A New Perspective on the US-China AI Race: 2025 Ollama Deployment Trends and Global AI Model Ecosystem Insights

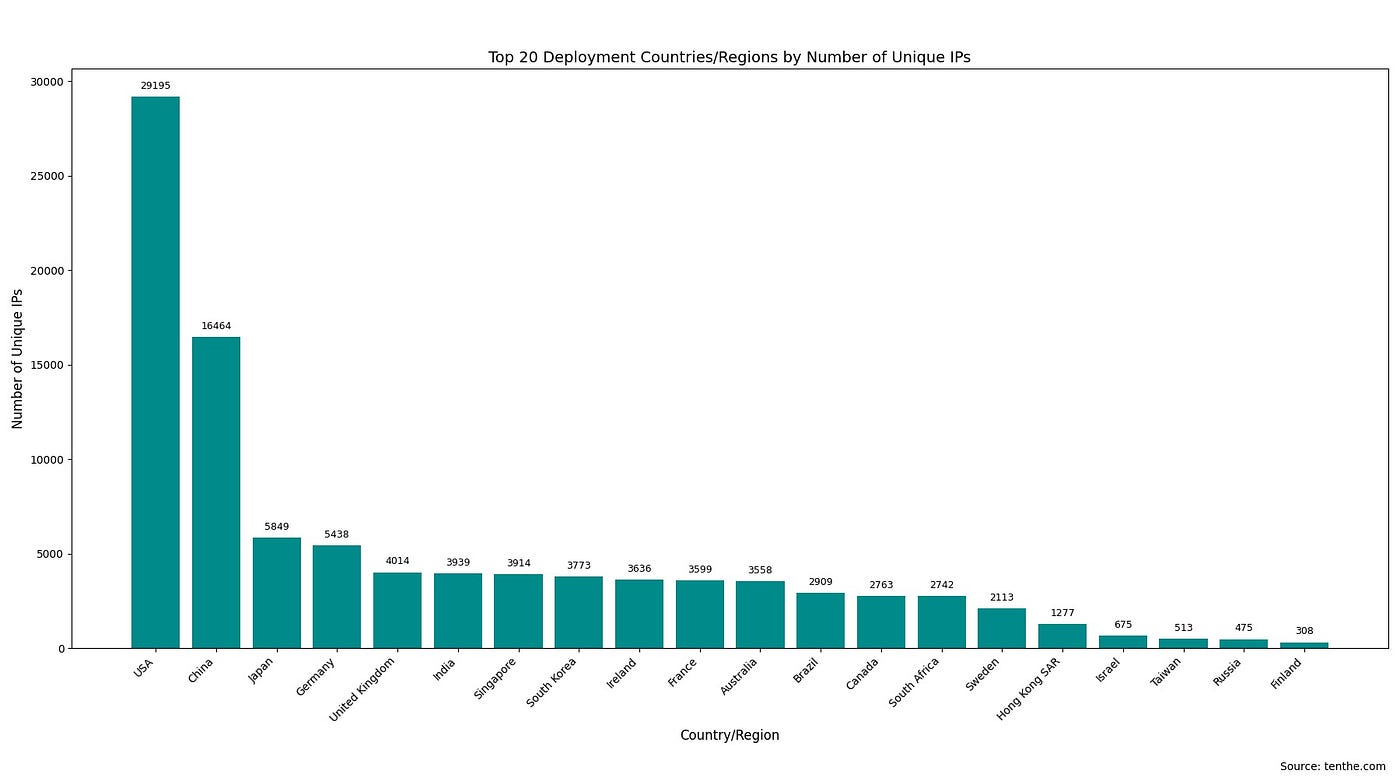
(Illustration: Top 20 countries by Ollama deployment volume)
I. How Open-Source Tools Are Reshaping AI Development
1.1 The Technical Positioning of Ollama
As one of the most popular open-source tools today, Ollama revolutionizes AI development by simplifying the deployment process for large language models (LLMs). By enabling local execution without reliance on cloud services, its “developer-first” philosophy is transforming the global AI innovation ecosystem.
1.2 Insights from Data Analysis
Analysis of 174,590 Ollama instances (including 41,021 with open APIs) reveals:
-
「24.18% API accessibility rate」 demonstrates strong collaborative spirit in open-source communities -
「300+ daily new deployments」 confirm rapid ecosystem growth -
「72% cloud-hosted instances」 indicate hybrid deployment as the dominant pattern
II. Global Deployment Map: The Tech Superpower Arena
2.1 National-Level Competition Dynamics

-
「United States (29,195 nodes)」: Core infrastructure hubs in Ashburn and Portland drive nationwide computing networks -
「China (16,464 nodes)」: Beijing-Hangzhou-Shanghai “AI Triangle” leverages domestic cloud services for rapid expansion -
「Second Tier」: Japan, Germany, and UK maintain deployments in 3,000-5,000 range
2.2 Urban Cluster Analysis
| Rank | US Cities | Chinese Cities | Global Counterparts |
|---|---|---|---|
| 1 | Ashburn (VA) | Beijing | Singapore |
| 2 | Portland (OR) | Hangzhou | Frankfurt |
| 3 | Columbus (OH) | Shanghai | Mumbai |
Geographical distribution patterns reveal:
-
Traditional tech hubs maintain leadership -
Emerging innovation zones forming secondary computing nodes
III. Model Selection: Developers’ Technical Roadmap Choices
3.1 Top Model Rankings

1. llama3:latest        - 12,659 nodes
2. deepseek-r1:latest   - 12,572 nodes
3. mistral:latest       - 11,163 nodes
4. qwen:latest          - 9,868 nodes
「Key Observations」:
-
Meta’s Llama series leads, but Chinese models (DeepSeek, Qwen) show competitive momentum -
:latesttags dominate (83%), reflecting developers’ focus on continuous iteration
3.2 The Art of Parameter Scaling

-
「7B-8B parameter models」 claim 62% market share, balancing performance and efficiency -
「XL models (≥50B)」 show 3.2x higher deployment in China, indicating specialized use cases
3.3 Quantization Techniques in Practice
Quantization Type Distribution:
Q4_K_M ████████████ 47%
Q4_0   ████████ 32%
F16    ███ 15%
4-bit quantization achieves:
-
60-70% memory reduction -
2-3x inference speed gains -
<3% acceptable accuracy loss
IV. Infrastructure Configuration Strategies
4.1 Network Architecture Features
| Configuration | Standard Practice | Technical Rationale |
|---|---|---|
| Port Usage | 11434 (default) – 81% | Simplified maintenance |
| Protocols | HTTP 72% vs HTTPS 28% | Development convenience priority |
| Cloud Providers | AWS (39%) > Alibaba (27%) | Regional service capability gaps |
4.2 US-China Deployment Pattern Comparison
+ US Preferences:
- Mid-tier GPU clusters (A10/V100)
- Standardized container deployment
- Automated maintenance systems

+ China Characteristics:
- Heterogeneous architectures (including domestic chips)
- 43% hybrid cloud deployments
- Custom monitoring solutions
V. Security Alert: The Double-Edged Sword of Open Source
5.1 Current Risk Landscape

-
「72% HTTP明文传输」: Exposes MITM attack risks -
「58% lack ACL配置」: Potential unauthorized access -
「34% use default credentials」: Increases breach probability
5.2 Best Practice Guidelines
-
「Encrypted Transmission」: Implement HTTPS via Nginx reverse proxy -
「Access Control」: JWT-based API authentication -
「Log Auditing」: Prometheus+Grafana monitoring stack -
「Version Control」: CI/CD pipelines for timely updates
VI. Future Trends: The Democratization of AI
6.1 Technical Evolution Directions
-
「Model Compression」: Median parameter size drops from 13B (2023) to 7.2B (2025) -
「Hardware Democratization」: Consumer GPUs to handle 70B models -
「Deployment Automation」: 217% YoY growth in Kubernetes integration
6.2 Ecosystem Development Forecast
graph LR
A[Open Models] --> B[Developer Communities]
B --> C[Vertical Solutions]
C --> D[Commercial Applications]
D --> A
This virtuous cycle will drive:
-
89% CAGR in edge computing deployments -
$5B+ model marketplace transactions -
Healthcare/education sector AI adoption surge
VII. Actionable Insights for Developers
7.1 Technology Selection Strategies
-
「Startups」: Prioritize 7B+Q4 quantization for cost-performance balance -
「Enterprises」: Implement multi-model ensembles combining Llama and Chinese models -
「Researchers」: Monitor localized adaptations like Chinese-LLaMA
7.2 Performance Optimization Path
# Typical optimization command
ollama run llama3:8b-text-q4_K_S \
--num-gpu-layers 32 \
--ctx-size 4096 \
--temp 0.7
Adjusting GPU layers and context length can boost inference efficiency by 15-30%
VIII. Crossroads of AI Development
The Ollama deployment data reveals three critical truths about the US-China AI race:
-
「Accelerated Democratization」: Open-source tools empower small teams with cutting-edge capabilities -
「Ecosystem Diversity」: No single model dominates all scenarios -
「Security-Efficiency Balance」: Convenience shouldn’t compromise protection
The ultimate victors in this silent competition will be those building open, secure, and sustainable AI ecosystems. For developers, understanding these deployment trends’ underlying logic proves more crucial than choosing any specific model.
