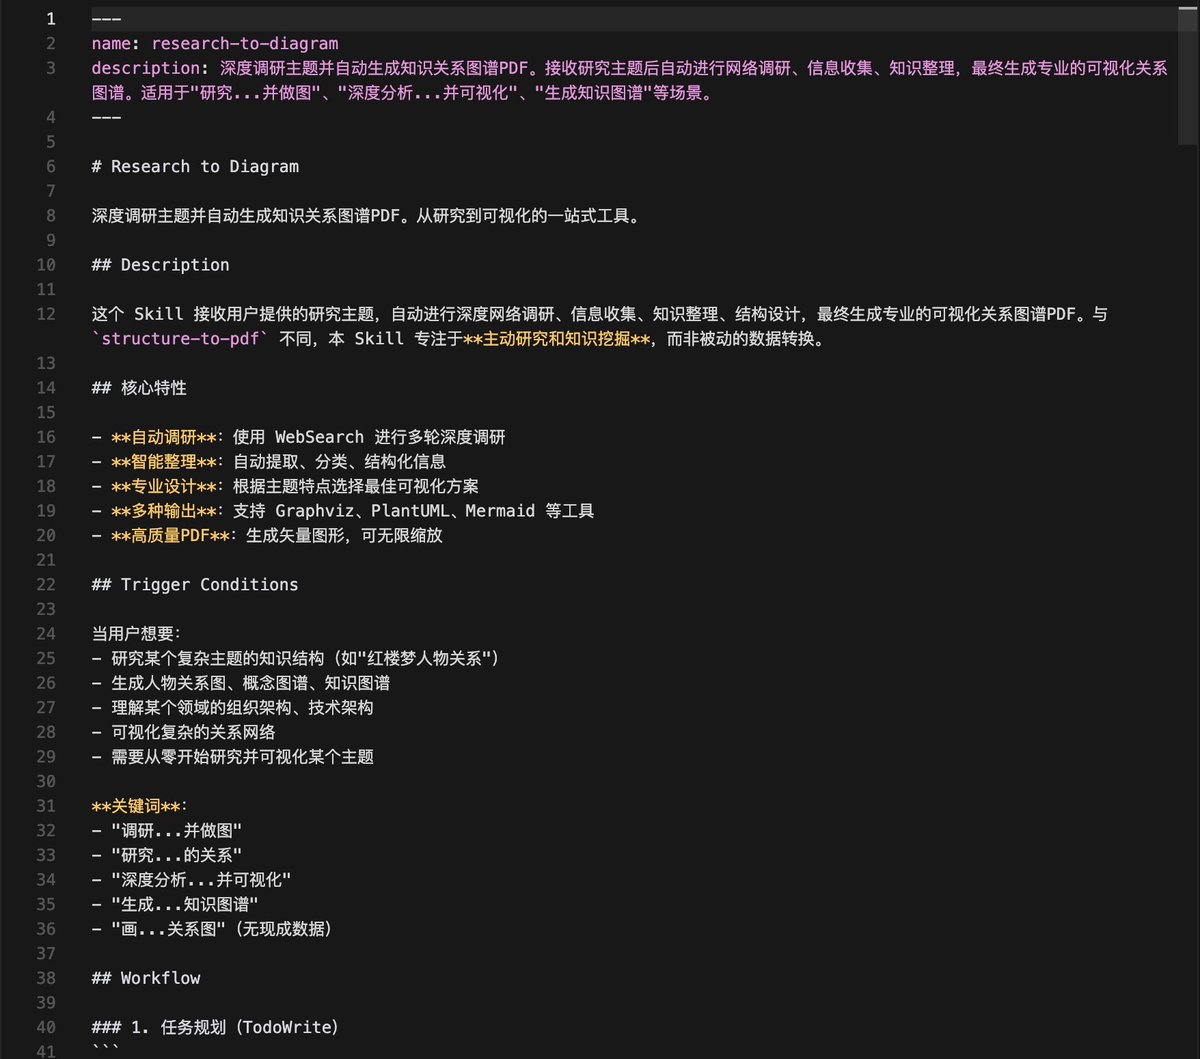
Say Goodbye to Tedious Research and Drawing: Generate Professional Charts with One Sentence Using AI
Have you ever struggled to untangle the complex character relationships in Dream of the Red Chamber? Have you ever wished for a clear timeline or map to help understand historical events while doing research? The traditional approach is painful: spend hours查阅资料, organizing data, then open专业绘图软件, carefully adjusting every node and connection. The entire process is time-consuming and daunting.
But now, things are completely different. Imagine simply saying one sentence to an AI, like: “Conduct an in-depth investigation into the relationships between characters in Dream of the Red Chamber and then create a structural diagram PDF.” Then, you can get up and make a cup of coffee. Three minutes later, a professionally formatted, clearly-organized, losslessly scalable vector PDF chart is already displayed on your screen.
This is not fantasy, but the real capability brought by a Claude Skill named research-to-diagram. It completely liberates us from the heavy cognitive load of “search-organize-draw”.
Origin: The Self-Cultivation of a “Lazy” Person
The birth of this tool stems from a very specific need. Its creator, Teacher Wang, wanted to create a character relationship chart for Dream of the Red Chamber after visiting the “Only Red Chamber Dream · Drama Illusion City.” He didn’t want a simple sketch, but a detailed vector diagram encompassing the Ningguo and Rongguo Mansions, the four major families, and core and peripheral characters, allowing for随意放大查看细节.
“Asking for this task before, it basically involved first determining the character relationships, then using drawing software to create it. But now with AI, what I want is no longer that kind of semi-automated tool where ‘I feed it data, and it helps me format.’ Because that would still require me to整理数据, how tiresome.”
Teacher Wang’s goal was clear: he wanted the AI to understand a vague instruction, then autonomously complete the entire process from web搜索, cross-verification, logical梳理 to professional chart creation. Thus, this “wheel” that can automatically perform deep research and generate charts was built.
See for Yourself: The Magic of One Sentence
How powerful is this tool? Let’s look at the results directly.
When inputting the instruction into Claude Code:
Conduct an in-depth investigation into the relationships between characters in Dream of the Red Chamber and create a structural diagram PDF.
The AI assistant begins its work. Note, the user did not provide any character list or relationship explanations.
-
Autonomous Research Phase: The AI initiates a web search (WebSearch). It doesn’t search just once; it acts like a rigorous researcher, conducting multiple rounds of layered检索:
-
First round: It searches for “Dream of the Red Chamber Jinling Twelve Beauties list” to identify core female characters. -
Second round: It searches for “Ningguo Mansion Rongguo Mansion genealogy” to clarify the main family branches. -
Third round: Upon discovering that Grandmother Jia’s maiden family is the Shi侯 family, it searches for “Four major families marriage alliances” to unearth deeper social networks.
-
-
Intelligent Organization Phase: After gathering information, the AI begins structuring the data. It identifies entities (e.g., Jia Baoyu, Lin Daiyu) and relationships (e.g., spouses, mother-child, political marriage), and categorizes them according to preset visual语法. For example, solid lines表示直接血缘 or marital关系, dashed lines表示政治联姻, and core characters are highlighted in red.
-
Automatic Chart Generation Phase: After about three minutes, the AI提示任务完成, generating a PDF file.
Opening the PDF reveals a chart rich in information yet exceptionally clear:
-
The Ningguo and Rongguo Mansions are clearly distinguished. -
The four major families—Jia, Shi, Wang, and Xue—each occupy a colored cluster. -
The emotional dynamics between Jia Baoyu, Lin Daiyu, and Xue Baochai are一目了然. -
Even关联人物 like Jia Yucun are properly placed in the diagram. -
Most crucially, it’s a vector graphic; no matter how much it’s enlarged, the edges remain sharp and clear.
(Partial示意 of the AI-generated Dream of the Red Chamber character relationship vector diagram)

From inputting the instruction to obtaining the chart, the entire process might only take the time you need to stand up and pour a glass of water. Work that used to take hours is now compressed into minutes.
Beyond Literature: Broad Application Scenarios
The potential of this tool extends far beyond analyzing literary works. Its core capability is “understanding complex systems and visualizing them,” making it applicable to numerous fields.
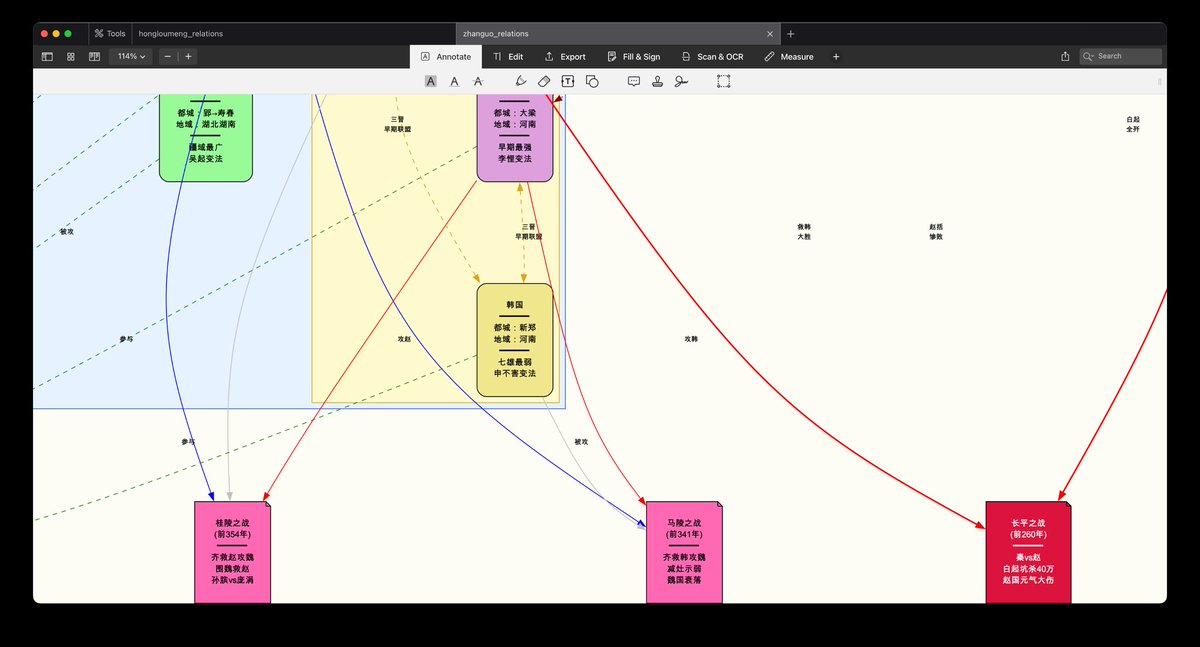
Historical Research: When you input “Research the relationships among the Seven Warring States during the Spring and Autumn and Warring States periods,” the AI generates a chronological脉络图.
-
It uses different colors to distinguish the State of Qin from the other six states. -
The diplomatic strategies of Vertical and Horizontal Alliances are clearly marked. -
Key battles (like the Battle of Changping) and their timelines are integrated into the relationship network, allowing直观理解 of how events influenced the格局.
(示意 of AI-generated Spring and Autumn and Warring States relations diagram)
Technical Architecture梳理: For developers or operations personnel, you can directly say: “Research the Kubernetes architecture and generate a technical architecture diagram.”
The AI automatically switches to a technical diagram template, presenting components like Master nodes, Node nodes, Pods, Services, and their interrelationships in a professional architecture diagram format, helping you quickly understand or explain complex systems to others.
Other Potential Scenarios:
-
Business Analysis: Research主要竞争对手 in an industry and their market share relationships. -
Knowledge梳理:梳理 the main thinkers of a philosophical school and the inheritance of their ideas. -
Project Management: Quickly绘制 a project stakeholder power-interest matrix diagram.
As long as your need is to “understand” and “present” the relationships among elements within a system, this tool can demonstrate its value.
How to Get Started? A Step-by-Step Installation Guide
By now, you’re probably eager to try it. Next, I’ll拆解 the installation and usage steps in detail. Rest assured, even without a technical background, you can complete the setup with the help of the AI assistant.
Core Preparation: Install the Graphing Engine Graphviz
The AI is responsible for thinking and designing, but what ultimately transforms the design into a chart is a time-tested open-source tool—Graphviz. You can think of it as a super-precise “automatic plotter.”
Installation methods:
-
macOS Users: Open “Terminal,” enter the following command, and press return: brew install graphviz -
Linux Users (e.g., Ubuntu): In the terminal, enter: sudo apt-get update && sudo apt-get install graphviz -
The Easiest Method (Recommended): If you’re already using Claude Code, you don’t even need to remember the commands above. Simply tell it in the Claude Code dialog: Please help me install the graphviz绘图引擎.
Claude Code will guide you or automatically execute the corresponding installation steps for you, handling any potential error messages.
Install the research-to-diagram Claude Skill
With the engine in place, let’s install the core skill. The simplest way is via Git clone locally.
-
Open the terminal. -
Enter and execute the following two commands sequentially: cd ~/.claude/skills git clone https://github.com/wshuyi/research-to-diagram.gitThis downloads the code from the open-source repository to your Claude Skills directory.
Similarly, you can also copy these two lines of commands directly to Claude Code and say: “Please help me execute these commands to install the research-to-diagram skill.” The AI will handle the entire process for you.
Usage: Triggering the Magic with One Sentence
After installation, using it is simpler than you can imagine. No complex configuration needed.
You only need to use natural language instructions containing specific intent in the Claude Code conversation to trigger this Skill. For example:
-
“Conduct an in-depth investigation into the main technical路线 of quantum computing and draw a comparison chart.” -
“Research the genealogy of the main gods in Greek mythology and generate a family tree diagram.” -
“Help me draw a relationship diagram of the COVID-19 variant传播时间线.”
The key is using keywords like “in-depth investigation,” “research… and generate a diagram,” “draw a… relationship diagram.” This is equivalent to telling the AI: “Please invoke your research-to-diagram skill and take this task seriously.”
Pro Tip: The more specific the instruction, the better the result. Compared to “draw a diagram,” using “conduct an in-depth investigation” drives the AI to perform more thorough web searches and information挖掘, potentially discovering and presenting关联细节 you were unaware of.
Technical揭秘: No Magic, Just a Rigorous Workflow
This skill seems like magic, but its core is a clearly defined, repeatable intelligent workflow. It模拟 the method of a rigorous researcher,大致可分为 into five steps:
Step 1: Layered Deep Research
The AI doesn’t just perform a simple search. Its research is layered and progressive:
-
Background Layer: First, search broad topics, e.g., “Spring and Autumn and Warring States background,” to establish a time frame and basic context. -
Entity Layer: Then search for specific entities, e.g., “which are the Seven Warring States,” “main historical figures,” to锁定 the nodes in the diagram. -
Relationship Layer: Finally, focus on connections between entities, e.g., “specific events of Vertical and Horizontal Alliances,” “battles and alliances between states,” to挖掘 the edges connecting nodes.
This approach of “building the skeleton first, then adding flesh” ensures the comprehensiveness and structure of the information.
Step 2: Structured Information Extraction
From杂乱无章的 webpage text, the AI needs to extract key information like a detective. It uses natural language processing techniques to identify “entities” and “relationships.”
-
When seeing the text “Jia Zheng is the second son of Grandmother Jia,” it extracts: Entity A: Grandmother Jia,Relationship: second son,Entity B: Jia Zheng. -
This triple information (head entity-relationship-tail entity) is the data cornerstone for building the知识图谱.
Step 3: Translation into Visual Language
This is the key step in transforming data into insight. The skill comes with预设多种 “visual语法” templates:
-
For Families, Organizational Structures: Uses a top-down ( rankdir=TB) layout, employingsubgraph clusterto box members of the same family or department together, forming visual groupings. -
For Timelines, Development Processes: Uses a left-to-right ( rankdir=LR) layout, arranging nodes in chronological order. -
For Highlighting Core Elements: Core人物 or key nodes use red ( #FF6B6B), secondary nodes use light blue (#4ECDC4), establishing information hierarchy through color.
(示意 of the core workflow logic of the research-to-diagram skill)
Step 4: Code Generation
Based on the results of the first three steps, the AI automatically writes a DOT language script understandable by Graphviz. This script precisely describes each node’s attributes, each edge’s direction, and the overall layout.
Step 5: Compilation and Output
The system calls the installed Graphviz engine to compile the DOT script into the final visualization file—typically a high-quality PDF vector graphic.
The entire process “encodes” human research and diagramming methodology for the AI, enabling it to tirelessly and consistently execute this complex task.
Frequently Asked Questions (FAQ)
1. Is this tool free?
Yes, the research-to-diagram Claude Skill itself is open-source and free. You can find its source code on GitHub. The main potential cost comes from the费用 of using the AI service itself (like Claude Code).
2. Is it necessary to use Claude and Claude Code? Are there more economical alternatives?
Not necessarily. Although the skill was initially designed for the Claude ecosystem, its concept and some components can be migrated. The original author specifically pointed out that high-performing domestic large models can be chosen as more economical alternatives.
For example, Zhipu AI’s GLM-4.7 model offers cost-effective programming and reasoning capabilities. You can subscribe to its service and configure the API settings of Claude Code (or similar tools) to switch the backend model to GLM-4.7, thereby obtaining a similar experience at a lower monthly cost (e.g., a Lite plan costing a little over ten RMB per month).
3. Does installation require strong programming skills?
Not at all. The entire installation process (installing Graphviz, cloning the skill repository) can be completed with the assistance of Claude Code by copying and pasting simple terminal commands. Even if you encounter errors, you can simply throw the error message to Claude Code, and it will guide you on how to resolve it. The process complexity has been greatly reduced.
4. What image formats can it generate?
The default and most recommended format is PDF, because it generates vector graphics that don’t blur upon无限放大, making it非常适合 for printing or embedding in academic reports. Theoretically, by modifying the skill configuration, common image formats like PNG and SVG can also be output.
5. How accurate is the researched information?
The AI’s research is based on its web search results. Its accuracy depends on the quality of the sources found. The skill’s design incorporates the concept of “cross-verification,” i.e., verifying key facts from multiple information sources. However, for rigorous purposes like academic or商业 use, it’s建议 to treat the generated chart as an excellent first draft and a research blueprint, with humans performing final fact-checking and refinement.
6. Besides relationship diagrams, can it create mind maps or flowcharts?
According to the original text, the visual templates of the skill can be extended. The author welcomes user requests (e.g., submitting an Issue on GitHub), and future support for more chart types like mind maps and flowcharts is possible. Its core capability—the process of “understanding instructions – researching – structuring – visualizing”—is相通.
Advanced Tips: How to Configure More Economical AI Models?
If you wish to try the more economical domestic model route, here’s an overview of reference configuration steps based on Zhipu GLM:
-
Subscribe to a Service: Visit the Zhipu AI Open Platform, register, and subscribe to a suitable plan (e.g., “Code Edition Lite”). -
Obtain an API Key: Create a new API Key in the platform console; this is your credential for calling the model. -
Create a Configuration File: On your computer, in the ~/.claude/directory (create it if it doesn’t exist), create a configuration file namedsettings-glm.json. -
Edit the Configuration: In this configuration file, fill in your API Key, model name (e.g., glm-4), API base URL, and other information. (Refer to the original article’s示意图 or the model provider’s documentation for the specific format). -
Launch the Application: When launching Claude Code, specify this configuration file via the command line: claude --dangerously-skip-permissions --settings ~/.claude/settings-glm.jsonThis way, your Claude Code will use the GLM model as the backend, allowing you to run skills like
research-to-diagramat a lower cost.
(示意图 of configuration file settings, API Key部分已隐去)

Conclusion: Let AI Handle the Tedium, Let Humans Focus on Thinking
Developing tools like research-to-diagram holds significance far beyond saving a few hours. It represents a shift in work paradigms.
In the AI era, the importance of “mastering the operational skills of a specific tool (like drawing software)” is diminishing. Meanwhile, the abilities to “pose precise, profound questions” and “define the systems and relationships that need visualization” are becoming increasingly crucial.
When you offload repetitive cognitive负荷 like searching, organizing, and formatting to AI, your brain gains freedom. You can use the saved time and energy for:
-
Deeply剖析 the societal and humanistic logic behind the rise and fall of families in Dream of the Red Chamber. -
Reflecting on the启示 that the Warring States strategies of Vertical and Horizontal Alliances hold for contemporary international relations. -
Designing more innovative technical architecture solutions. -
Engaging in deeper critical thinking and creation within your专业领域.
Perhaps this is the role humans should more aptly play in the intelligent age: becoming commanders of thought, rather than搬运工 of information and美工 of charts.
This powerful research-to-diagram Claude Skill project is open-source on GitHub. You can obtain, use, and study it for free. If you find it useful, consider giving the project a Star to show your support. If you encounter issues while using it or have ideas for improvement (like adding new chart types), you are also very welcome to provide feedback via GitHub’s Issue or Pull Request features.
Let’s leverage AI as this powerful partner to explore knowledge more efficiently and present ideas more clearly.
Project Open Source Address: https://github.com/wshuyi/research-to-diagram