code996: Analyze Git Commit Patterns to Understand Work Intensity
code996 is an analysis tool that examines the time distribution of Git commits in a project, helping you understand the actual coding work intensity.
It’s a practical way to explore the working patterns of a new team and identify potential overtime cultures.
This is the updated Node.js version with enhanced features. The older version has been migrated to code996-web.
What code996 Does
When interviewing for a new job, we often ask about overtime policies—but the answers can be unreliable.
However, code doesn’t lie. The timestamps of code commits tell a more honest story, which is why code996 was created.
When you join a new company, simply run npx code996 in the project repository to see the reality behind the data. This helps you judge the company’s true overtime culture before making long-term commitments.
It’s better to discover the truth early than to regret after three months of struggling through a trial period.
What You’ll See: Previews of Results
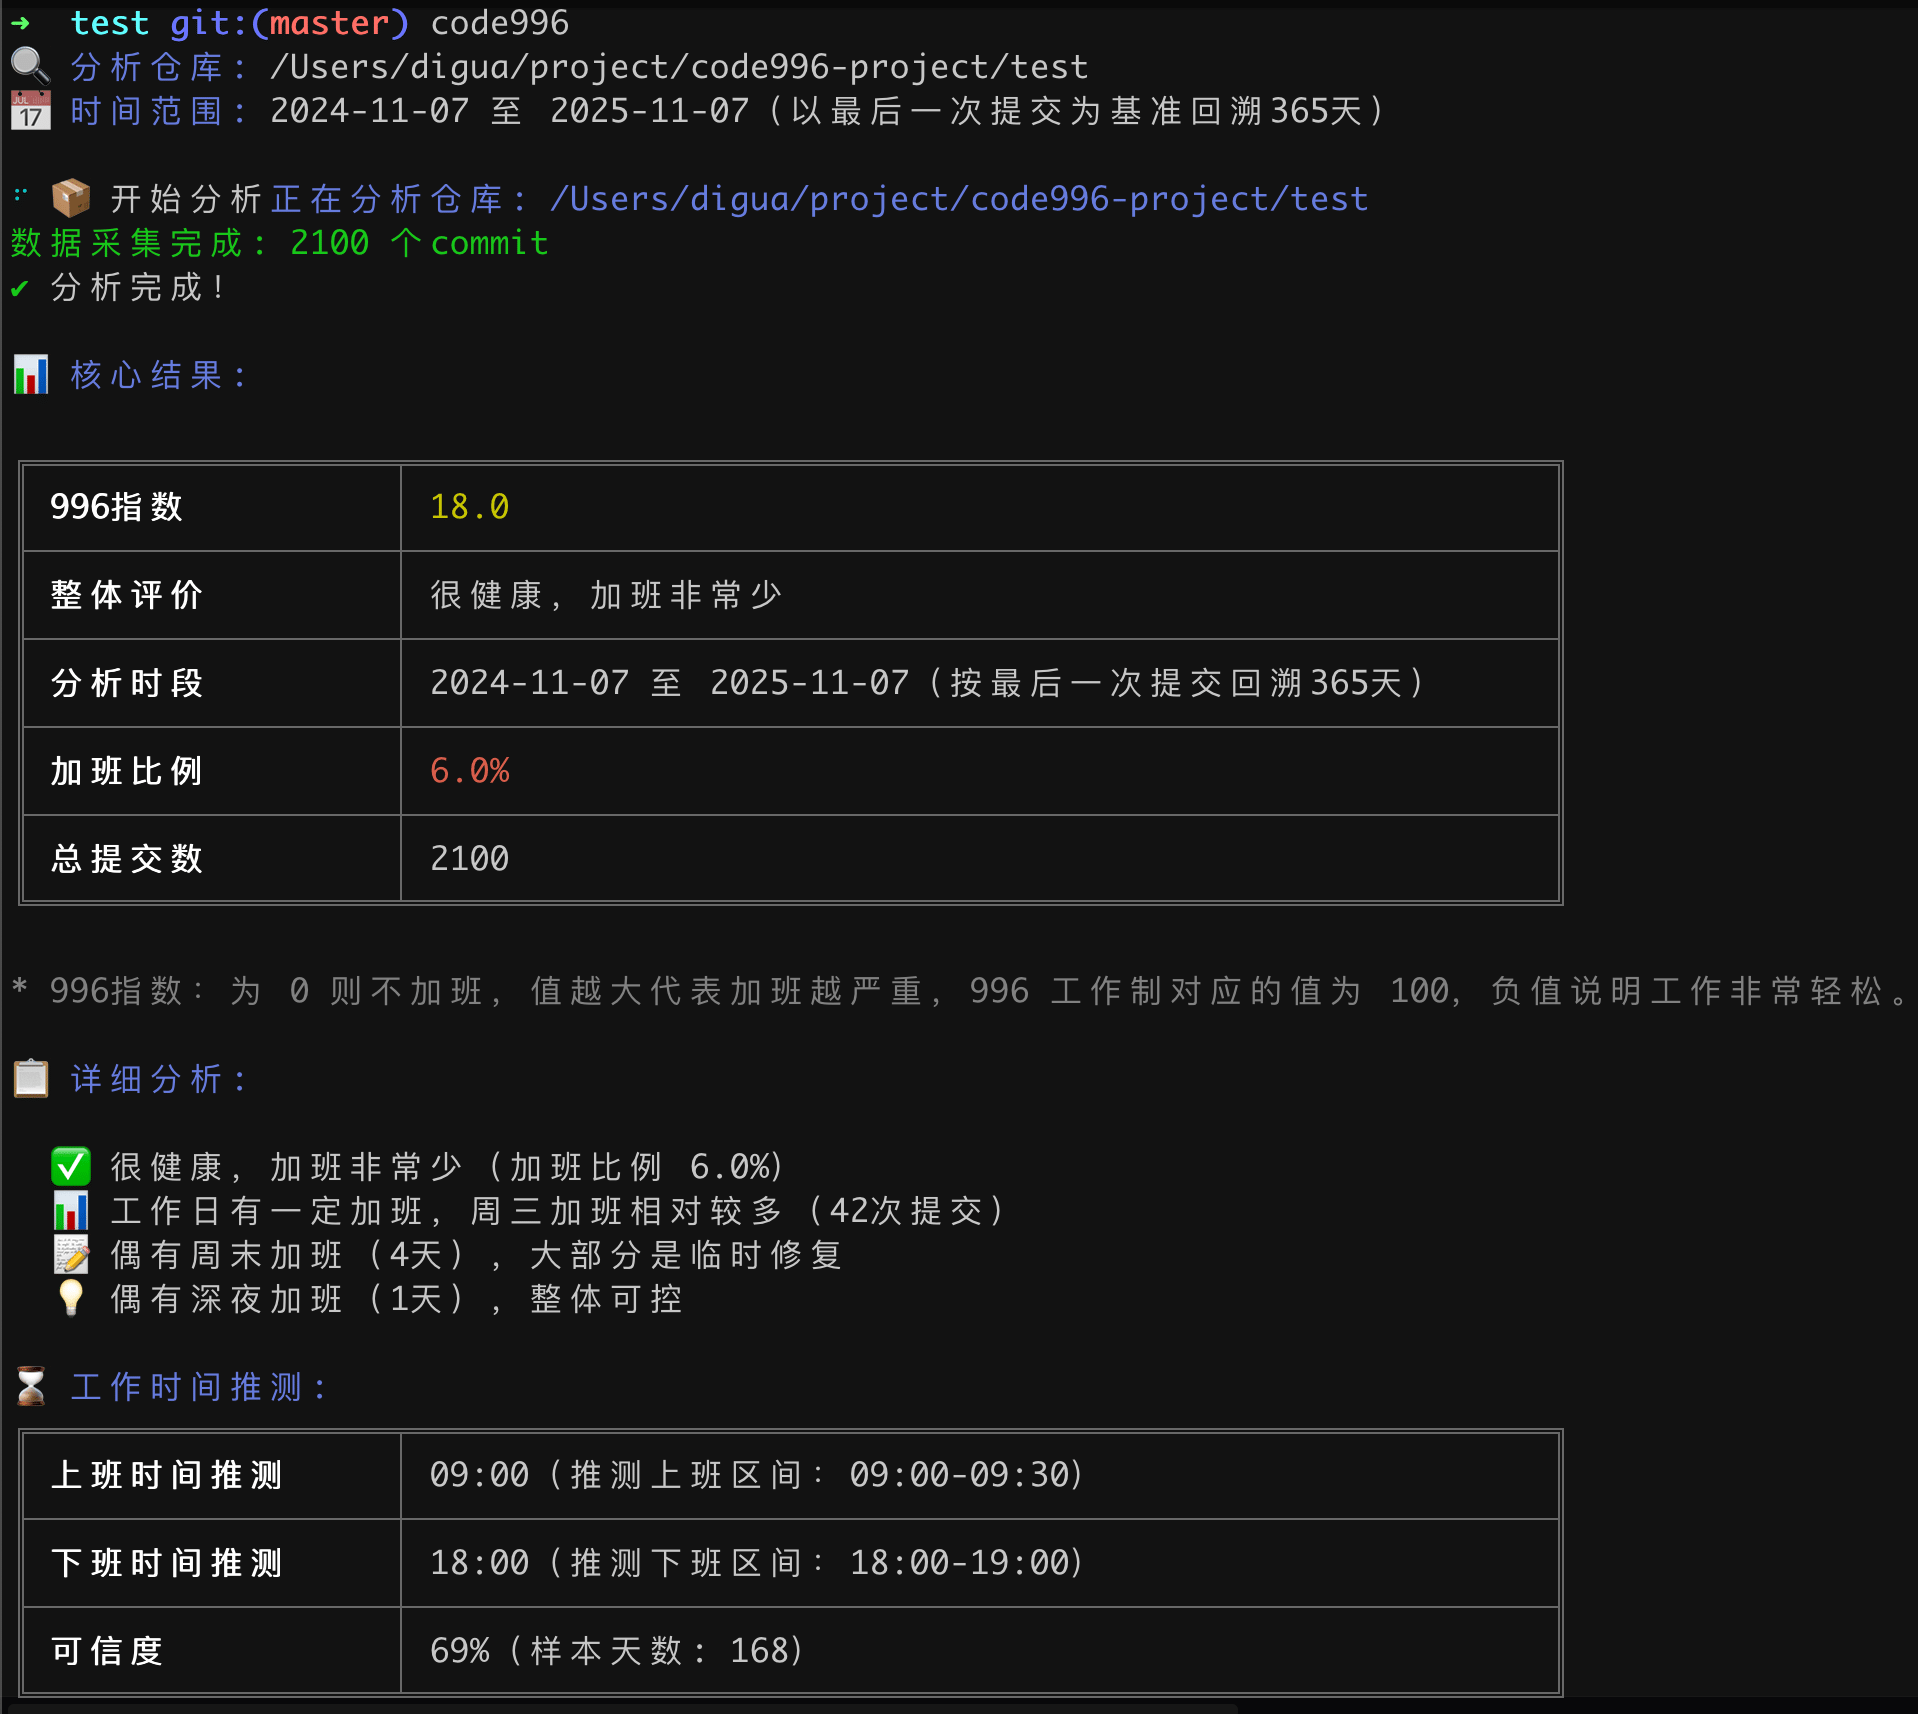
Core Analysis Results

This screenshot shows the key metrics and overall assessment of work intensity, giving you a quick overview of the team’s commit patterns.
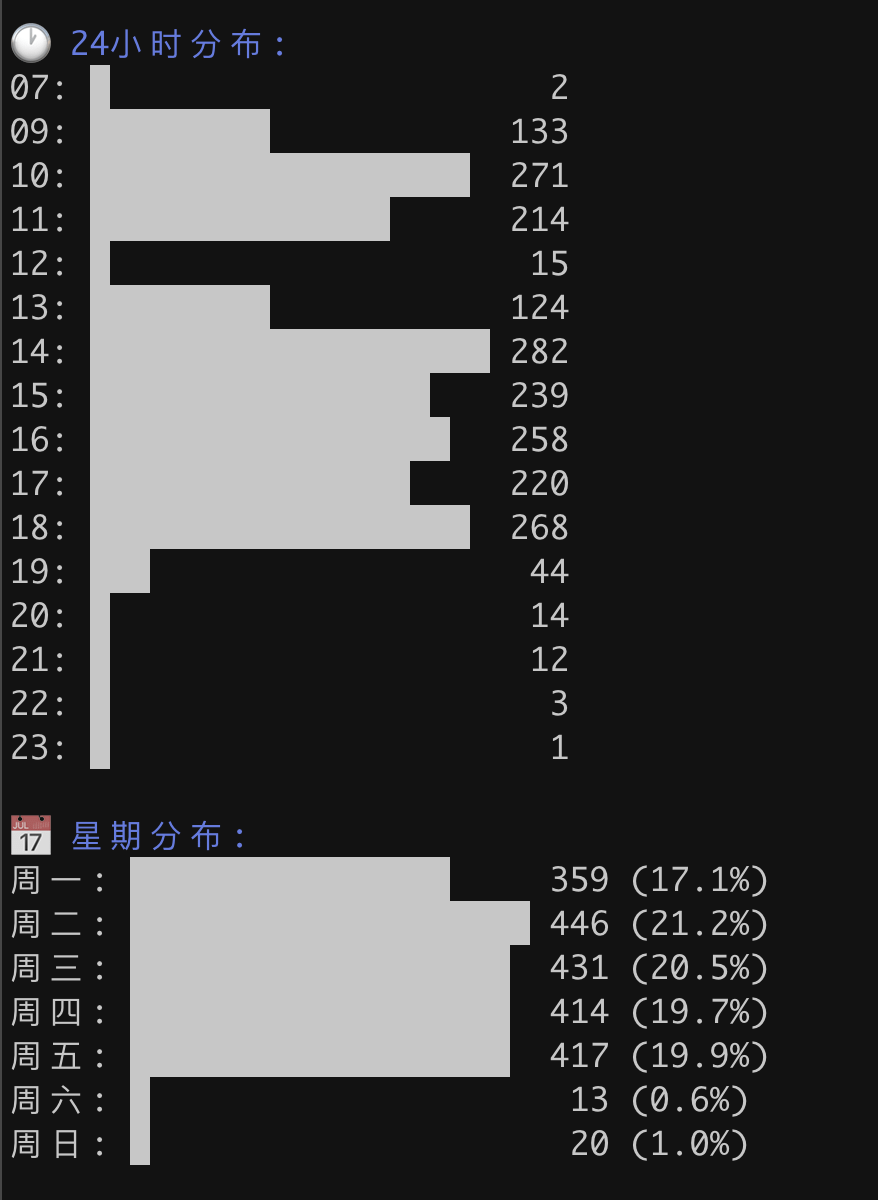
Commit Time Distribution

This visualization breaks down when commits happen throughout the day, revealing peak working hours and off-hours activity.
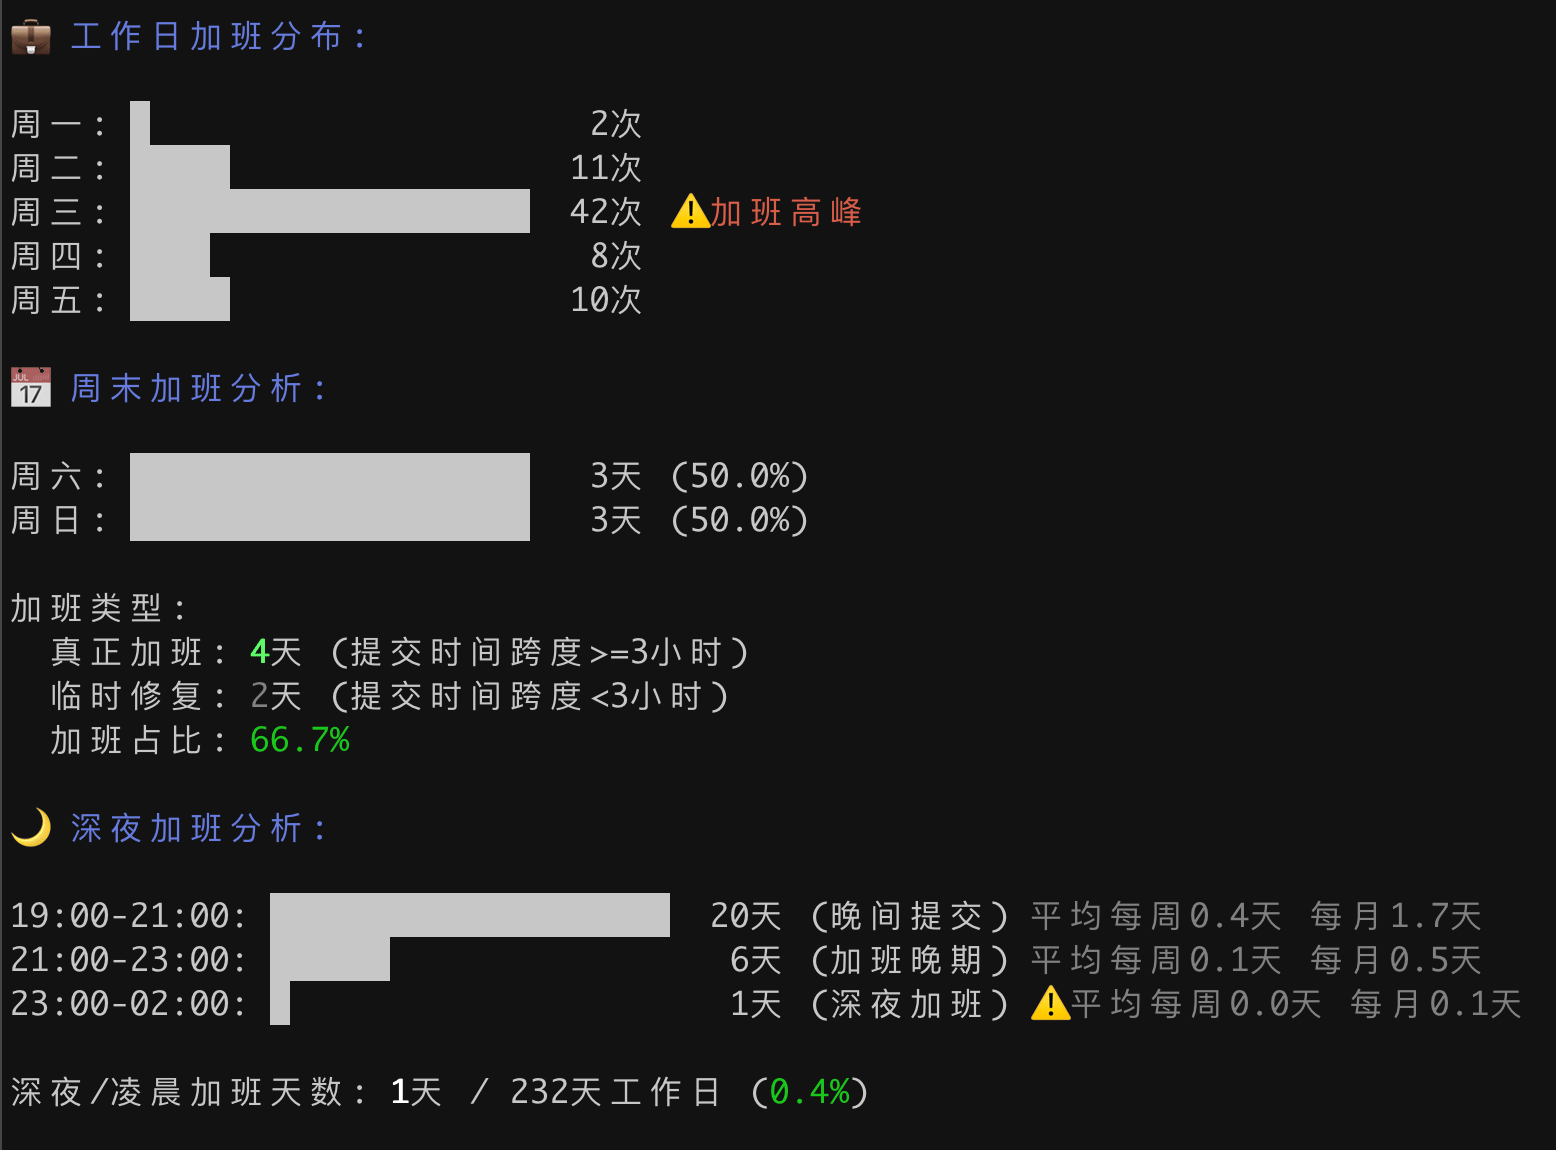
Overtime Analysis

This detailed analysis highlights patterns of after-hours work, showing how often and how late the team commits code outside standard hours.
Comprehensive Recommendations

Based on the data, this section provides practical insights to help you interpret the results and make informed decisions.
🚀 Getting Started Quickly
You don’t need to install anything to start using code996. Just run it directly:
# Analyze the current repository (by default, checks commits from the past 365 days up to the latest commit)
npx code996
If you plan to use it regularly, you can install it globally to avoid redownloading each time:
# Install globally
npm i -g code996

# Run after installation
code996
📖 Detailed Usage Guide
Basic Commands and Options
-
multi: Analyze multiple Git repositories, combining results to show overall 996 indices and monthly trends (includes a detailed 11-column trend table) -
help: Display help information
Time Range Options
-
-y, --year <year>: Specify a single year or a range of years (recommended)-
Single year format: 2025→ Analyzes from 2025-01-01 to 2025-12-31 -
Range format: 2023-2025→ Analyzes from 2023-01-01 to 2025-12-31
-
-
-s, --since <date>: Custom start date (format: YYYY-MM-DD) -
-u, --until <date>: Custom end date (format: YYYY-MM-DD) -
--all-time: Analyze the entire history of the repository
Filtering and Display Options
-
--self: Only count commits from the current Git user -
-H, --hours <range>: Manually set standard working hours (e.g., 9-18 or 9.5-18.5) -
--half-hour: Show time distribution in 30-minute intervals (default is hourly)
Usage Examples
# Analyze by year
code996 -y 2025                # Analyze the year 2025
code996 -y 2023-2025           # Analyze the years 2023 to 2025

# Precise date range
code996 --since 2024-01-01 --until 2024-06-30  # Analyze the first half of 2024

# Analyze entire repository history
code996 --all-time

# Analyze only your own commits
code996 --self                  # Show only your commits in the default time range
code996 --self -y 2025          # Show only your commits from 2025

# Analyze multiple repositories (automatically includes monthly trend analysis)
code996 multi                   # Scan all subdirectories of the current folder and show trends
code996 multi -y 2025           # Analyze 2025 data and trends across multiple repositories
code996 multi --self            # Show only your commits across all repositories
code996 multi /path/to/repo1 /path/to/repo2  # Specify exact repository paths to analyze

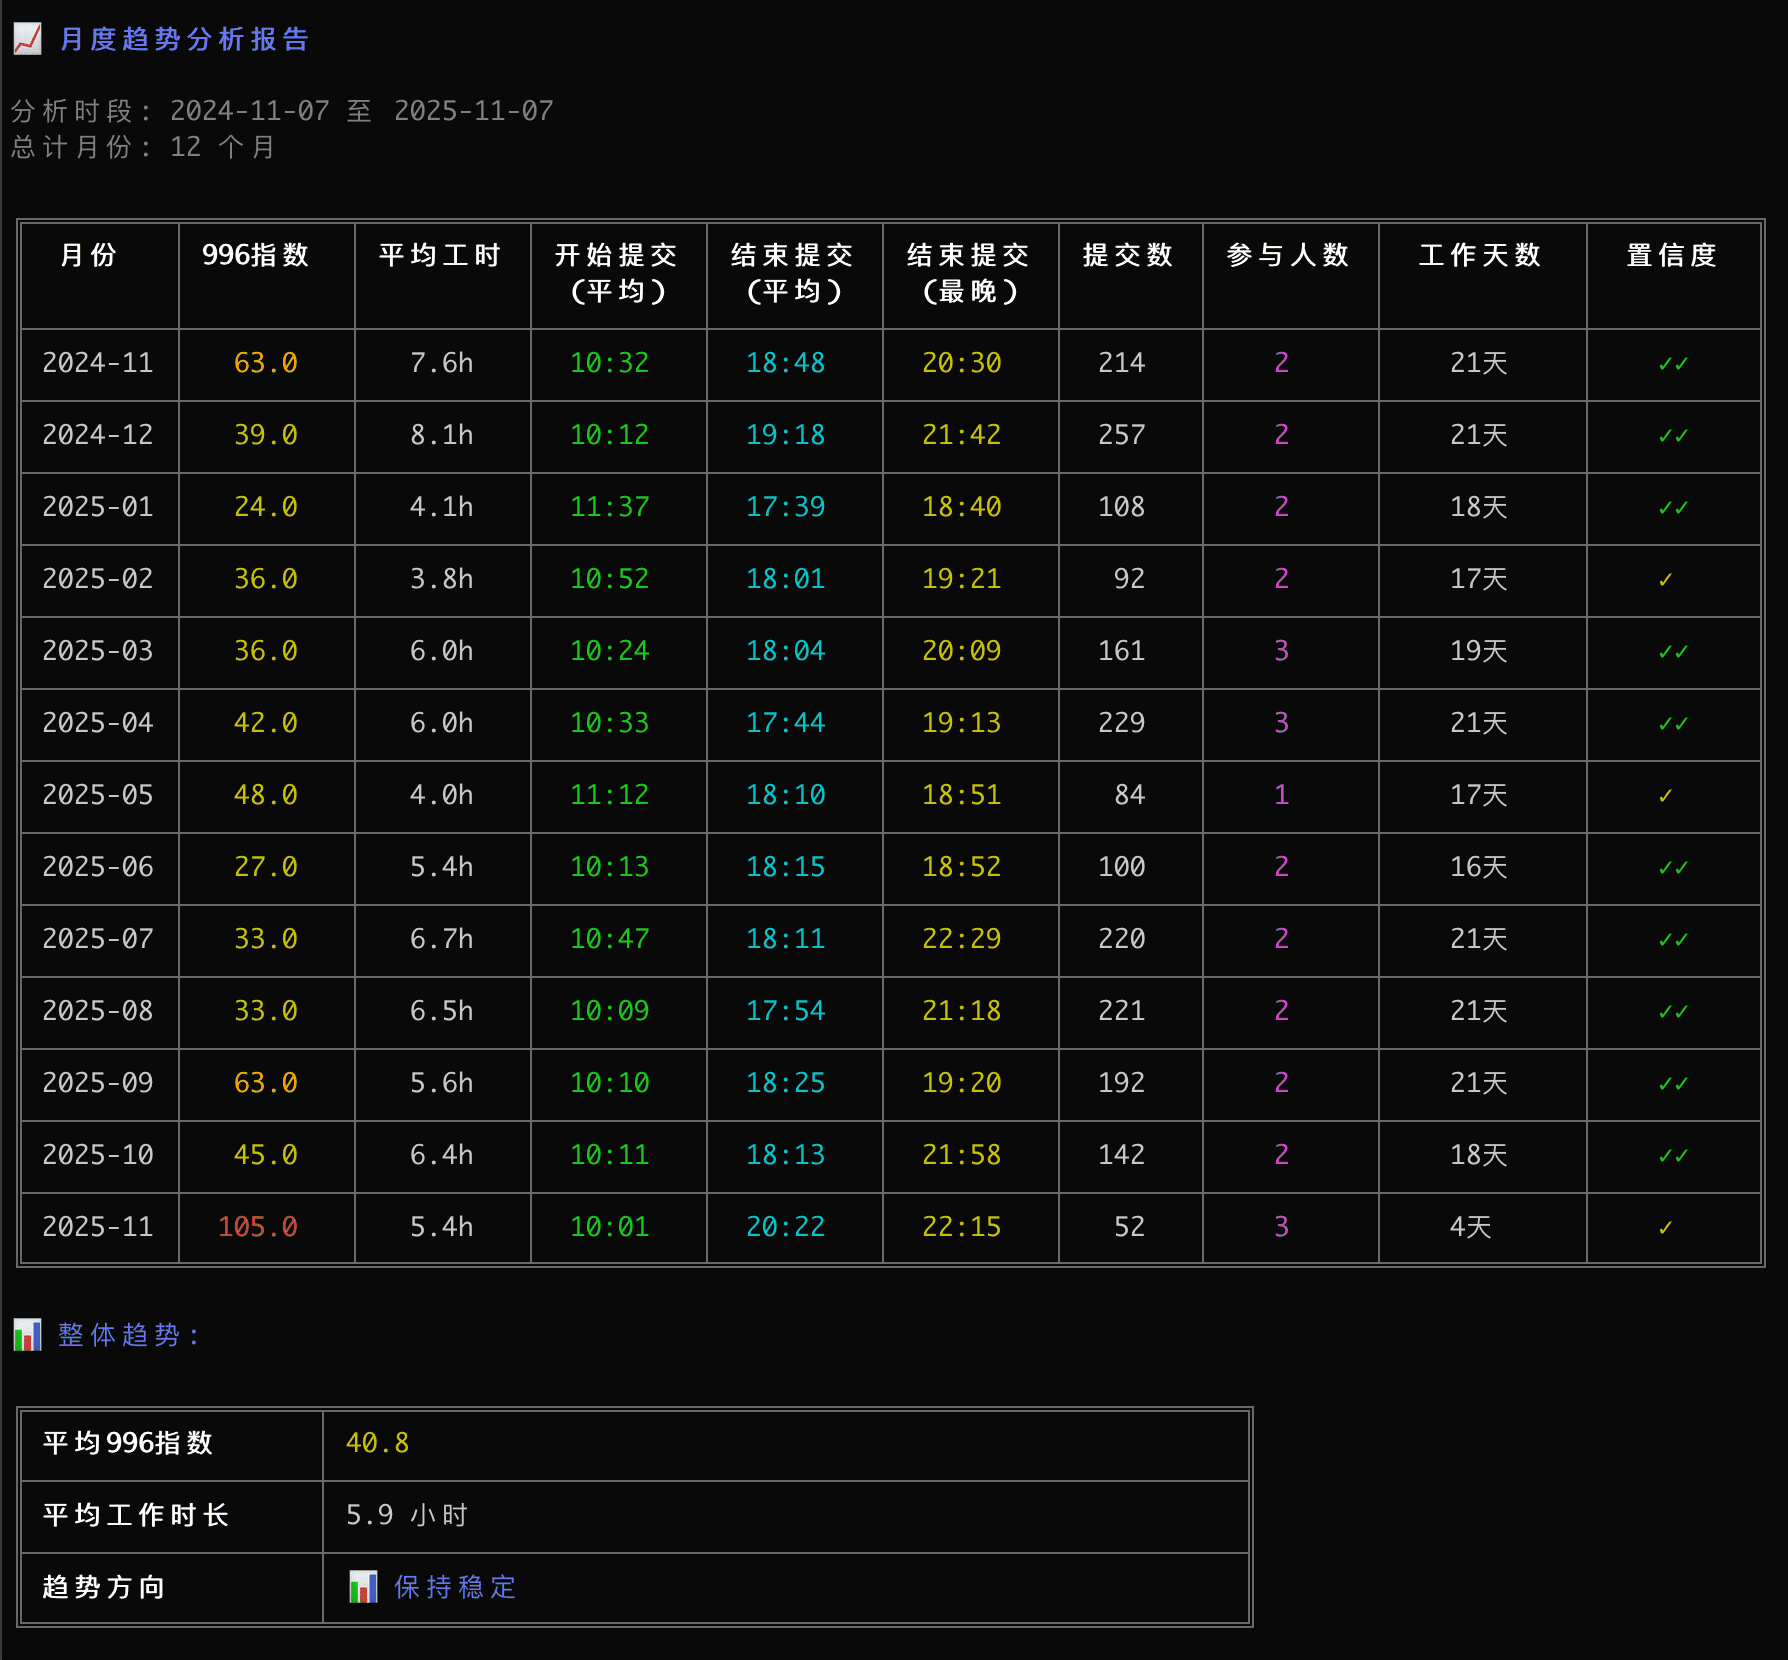
# 📈 Monthly trend analysis (included automatically with the 'multi' command)
# The 11-column table includes:
#   - Changes in 996 index over time
#   - Average/earliest/latest commit times
#   - Work duration and stability analysis
#   - Number of contributors
#   - Confidence rating (based on commit count and working days)

# Detailed analysis (30-minute intervals)
code996 --half-hour            # Show time distribution in 30-minute blocks
code996 -y 2025 --half-hour    # Combine yearly analysis with 30-minute detail
code996 multi --half-hour      # Analyze multiple repositories with 30-minute intervals
💡 About the 30-Minute Interval Feature:
The default mode shows data in hourly blocks (e.g., 09:00, 10:00) for simplicity and clarity Use the --half-hourparameter to see 30-minute intervals (e.g., 09:00, 09:30, 10:00) for more detailUnder the hood, data is always collected in 30-minute intervals (48 time points per day). The algorithm automatically combines these into hourly blocks to calculate the 996 index, ensuring accuracy Best for: Detailed analysis of commit patterns, revealing small fluctuations in work times
How code996 Works
code996 uses Git’s built-in logs to gather commit data, then processes it locally to generate easy-to-understand results.
The Data Collection Process
Git Repository → Collect data with git log → Daily first commits + hourly distribution → Estimate work start/end times using quantiles → Calculate 996 index → Display results
Key Algorithms
-
Time Distribution Analysis:
-
Data collection: Captures commit times down to the minute, automatically grouping them into 48 half-hour intervals -
Processing: Aggregates these 48 intervals into 24 hourly blocks for identifying working hours and calculating the 996 index -
Display: Defaults to hourly blocks (24 points) but can show 30-minute intervals (48 points) for more detail
-
-
Working Hour Identification:
Uses the 10%-20% quantiles of recent data to estimate standard start times. For end times, it looks for “inflection points” in evening commits—sudden drops in activity that indicate when most people stop working. -
996 Index Calculation:
Builds an index based on the proportion of overtime commits, with clear descriptions in plain language to explain what the score means. -
Data Validation:
Checks that the statistics match the total number of commits to avoid errors from missing data. -
Algorithm Advantages:
The updated version uses quantiles and inflection point analysis to smartly filter out random late-night commits, focusing on real working hours for more accurate results.
Usage Tips
-
Privacy Protection: All analysis of Git data happens locally on your device. No results or logs are uploaded to any server. -
Limitations: The tool only looks at commit times in git log. Remember that real work includes meetings, learning, documentation, debugging, and testing—activities that don’t always show up in commit history. For this reason, the results can’t capture the full picture of working hours. Please use them as a reference, not a definitive measure. -
Usage Restrictions: The analysis is for personal reference only. Do not use it for harmful purposes or inappropriate actions. -
Disclaimer: code996 is not responsible for any consequences resulting from the use or sharing of this tool or its outputs.
About AI Collaboration
🤖 Note to AI Collaboration Partners: This project follows standardized AI collaboration processes. For details, see the collaboration guidelines in .docs/README.md.
Special thanks: This project was developed using KwaiKAT’s KAT-Coder-Pro V1. We appreciate KwaiKAT for providing free tokens to support this development.

